08 Oct Market Update September 2019
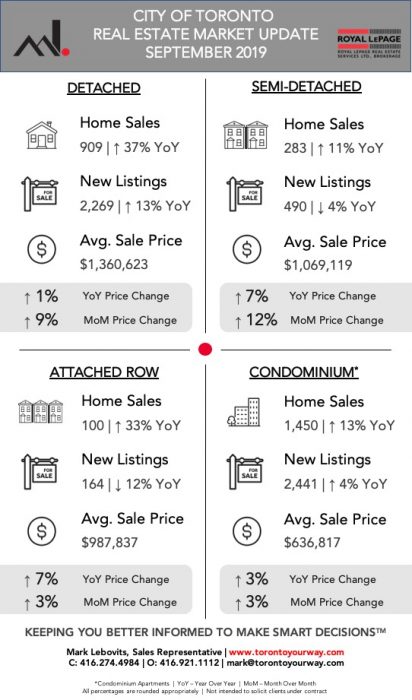
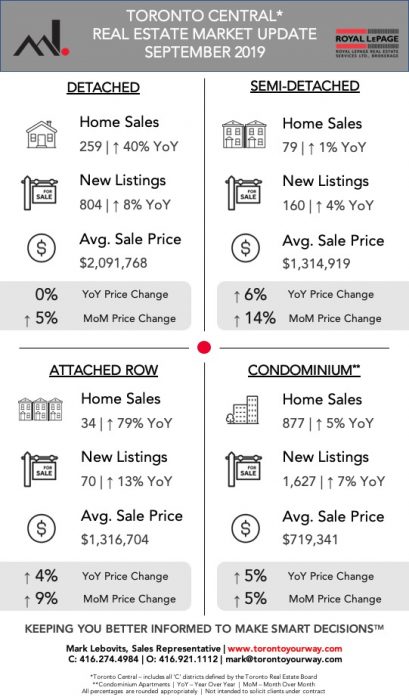
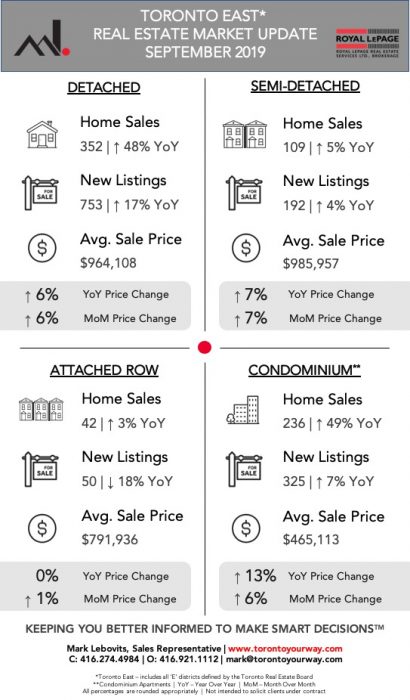
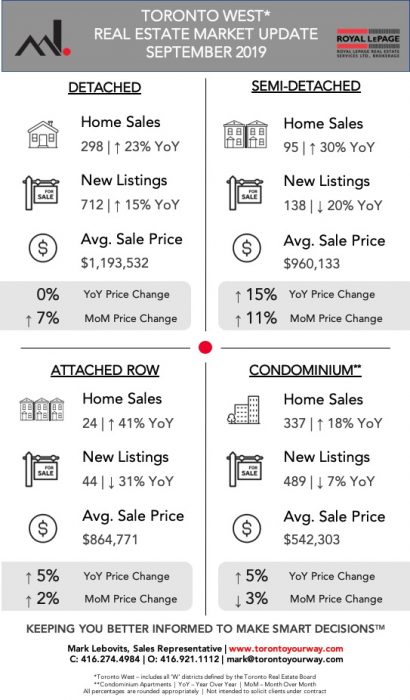
Last month, year-over-year overall housing prices were up 5.6% in the City of Toronto. Below I have broken out the keys statistics by Toronto’s districts (Central, West & East), as defined by TREB, for a more in depth geographic look at how the numbers played out for September 2019.
Want to know what this would mean for you if you decide to buy or sell a home? Call me today at 416-274-4984 or send me an email mark@torontoyourway.com
There’s absolutely No Obligation – I am always available to discuss real estate trends and how you stand to benefit in the current market environment.
CITY OF TORONTO

TORONTO CENTRAL (C01-C15)

TORONTO EAST (E01-E11)

TORONTO WEST (W01-W10)


